Creative Code Fellowship Week 7: Almost ready for the Needle

I’ve been dialing in my Processing and openFrameworks pattern making tools. I’ve also been making some conceptual cuts in terms of how many themes I can use, mainly on the basis of which symbology is the strongest. These are designs that I will most likely print:

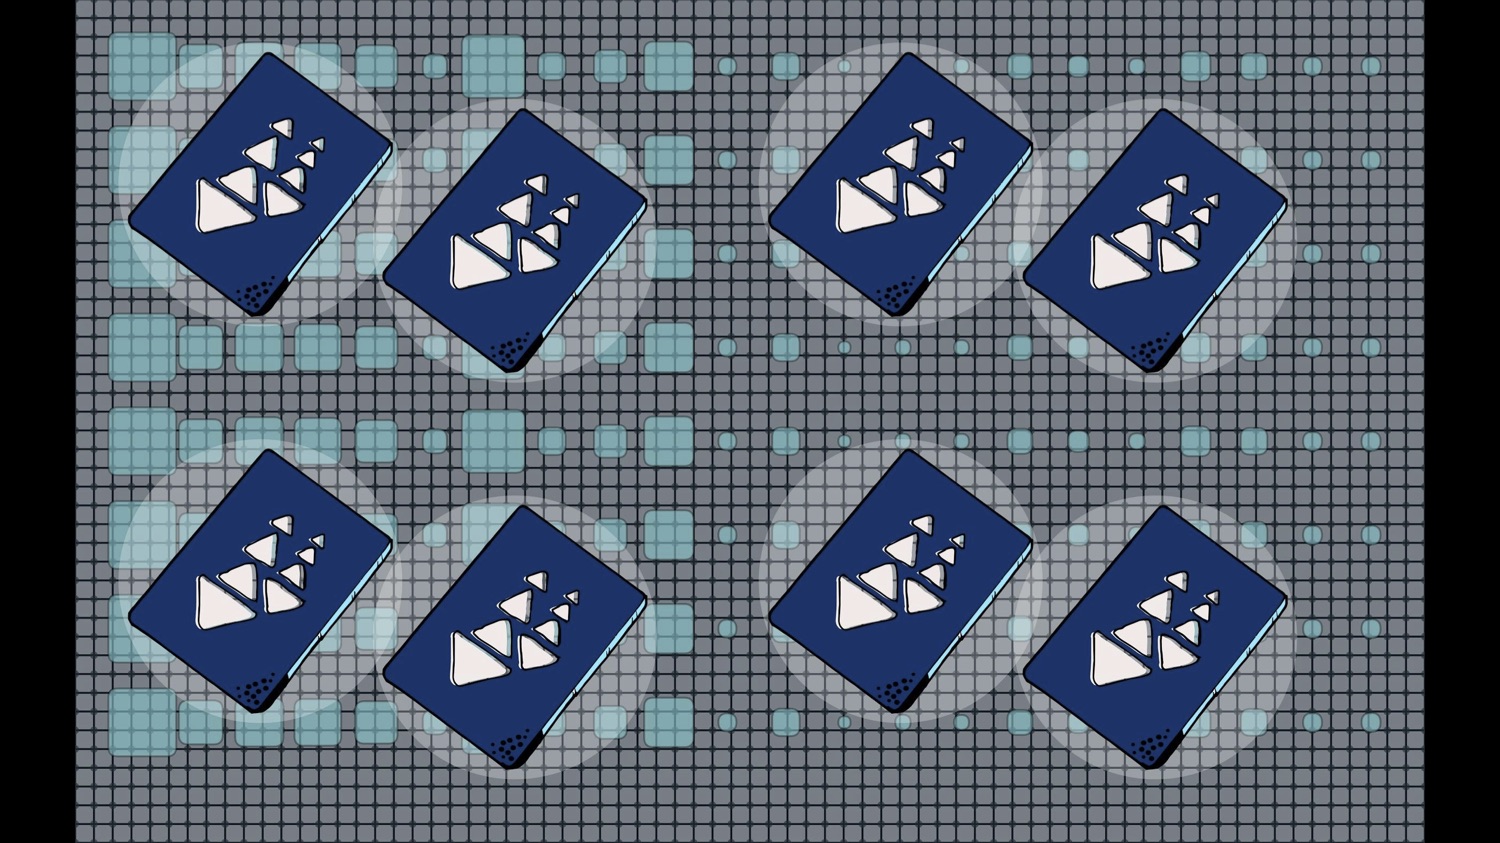
Clipper >>>>>>>Data represented at yellow arrows: Traffic volumes at regional (freeway) gateways >>>>>>data source

Mission Street Condo >>>>> Data, represented as inverted dot graph: Quarterly San Francisco Median Home Values 1990 - 2014 >>>>>  data source 

Street Vending / Coding Mash Up: HTML Frozen Treats >>>>> Data, represented as droplets from left to right : Quanity of people claiming food insecurity in the Bay Area 2001 -2013 data source + Data, represented as dot spiral : Mobile food vending permits issued in San Francisco >>>>>  data source

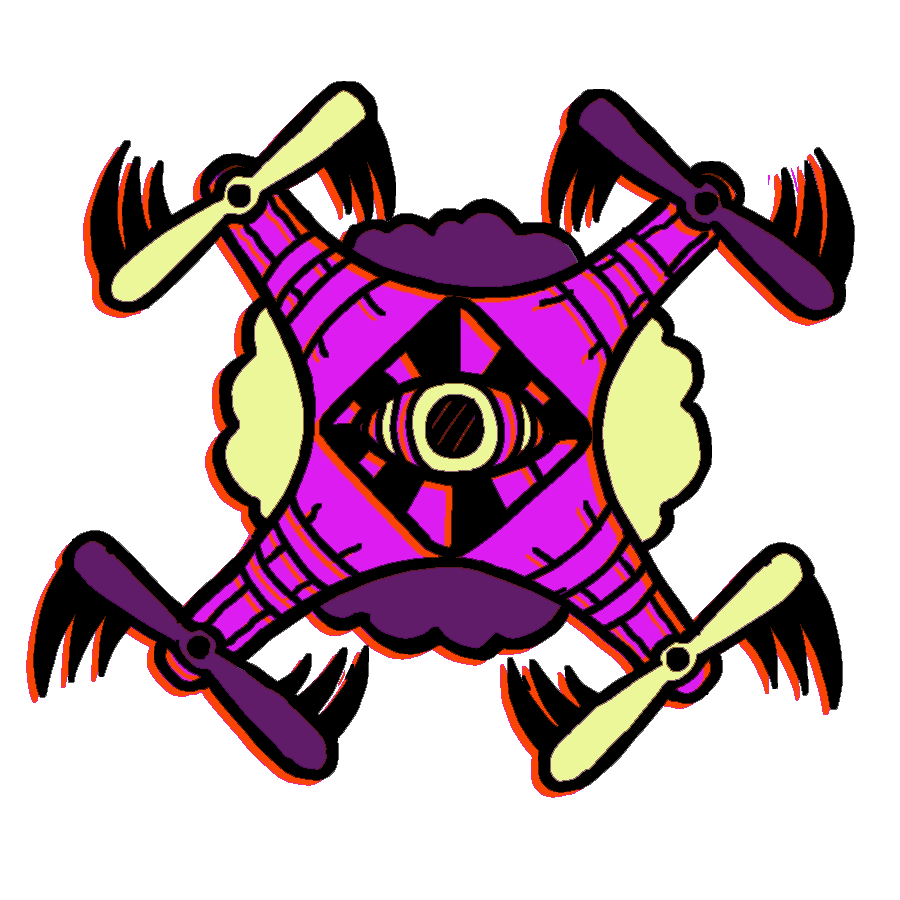
Drone >>>>> Data, represented as stars: Close calls between pilots and drones reported, by state, to the FFA in 2014. California is the largest of the stars with 25 "close calls" reported. >>>>>> data source

$900 month Tent >>>>> Data, represented as magenta lines: San Jose Average monthly rent 2009-2015  >>>>>  data source.

Based on this

One of these is a maybe:

Car Services of San Francisco >>>>> Data represented as sine waves: Wage growth, by race/ethnicity, comparing 2000 to 2012. Every two lines, starting at the top, represents a race/ethnicity: White, Black, Latino, Asian/Pacific, Native American, Other. >>>>> data source

Car Services of San Francisco >>>>> Data represented as stars: Wage growth, by race/ethnicity, comparing 2000 to 2012. Every two start, starting at the left, represents a race/ethnicity: White, Black, Latino, Asian/Pacific, Native American, Other. >>>>> data source

I have finished fabrics coming of these 4 designs (3 yards each):

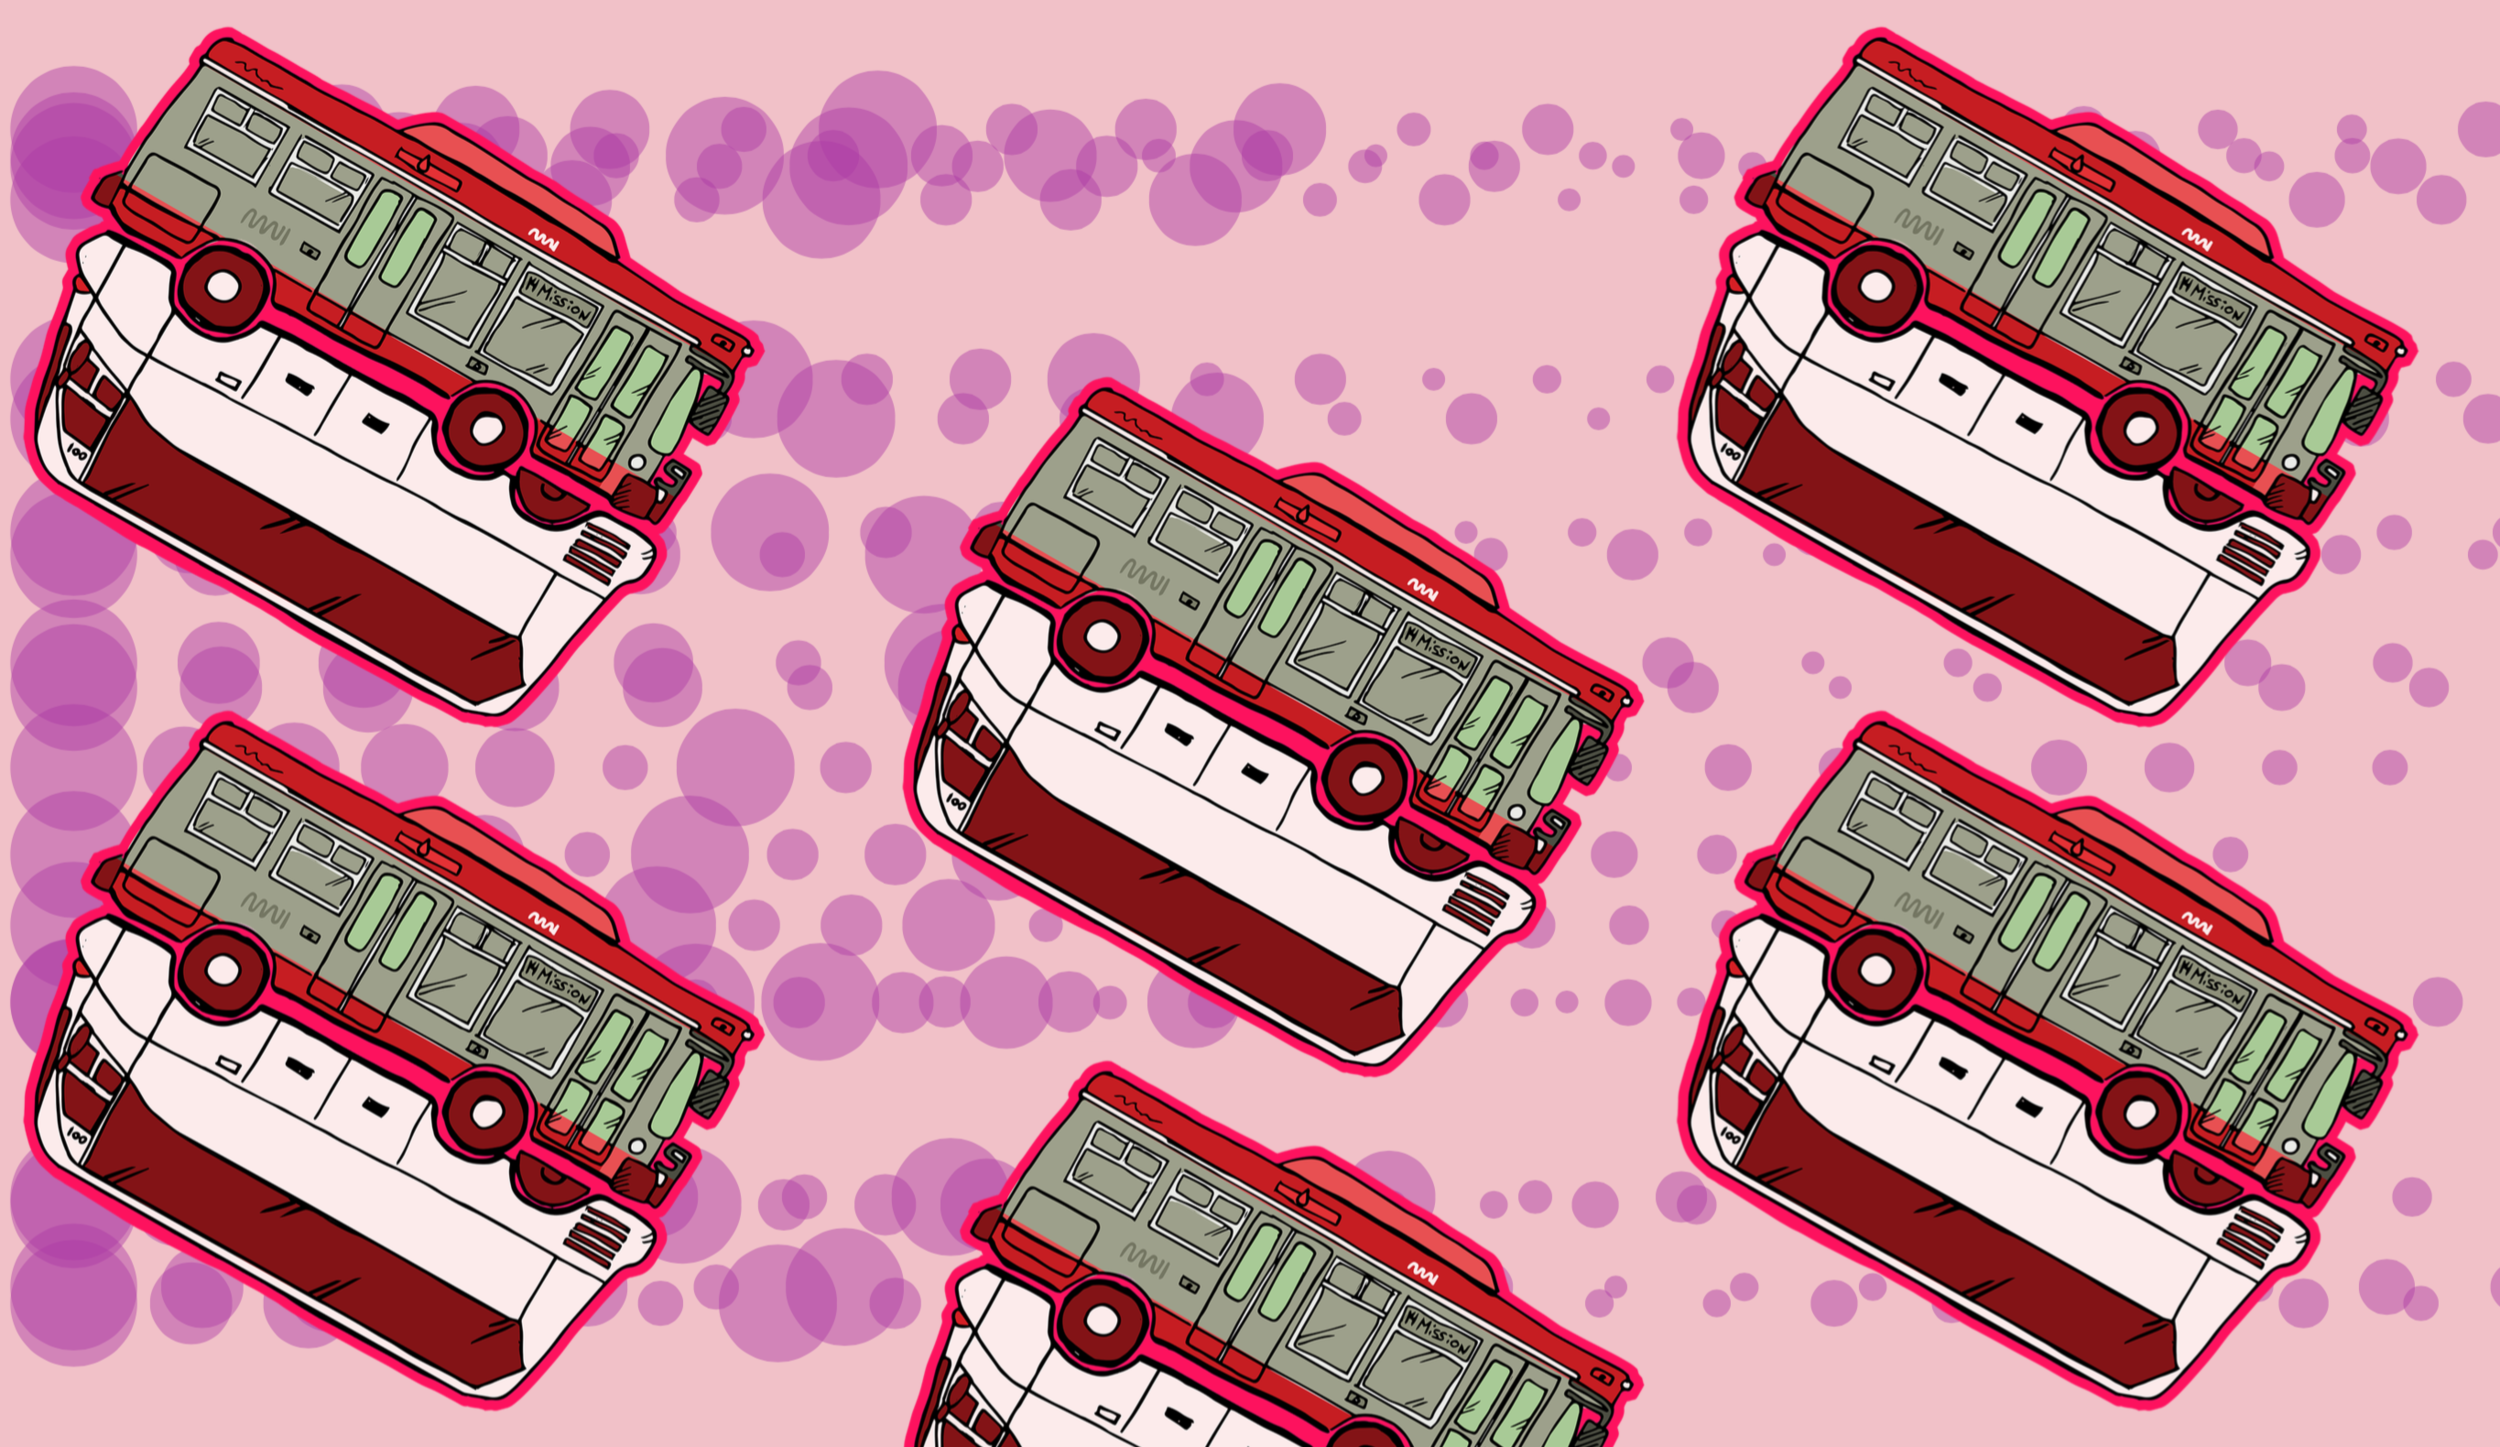
Buses of San Francisco >>>>>> Data, represented as circles from left to right : Gender and diversity data from 6 major Bay Area tech companies. Rightmost data: San Francisco ethnicity breakdown according to 2013 US census data  >>>>>> data source

Street Vending / Coding Mash Up: CSS Tamales >>>>> Data, represented as polygons from left to right : Average Hourly wage for 22 San Francisco occupations as defined by the Bureau of Labor Statistics  >>>>>  data source

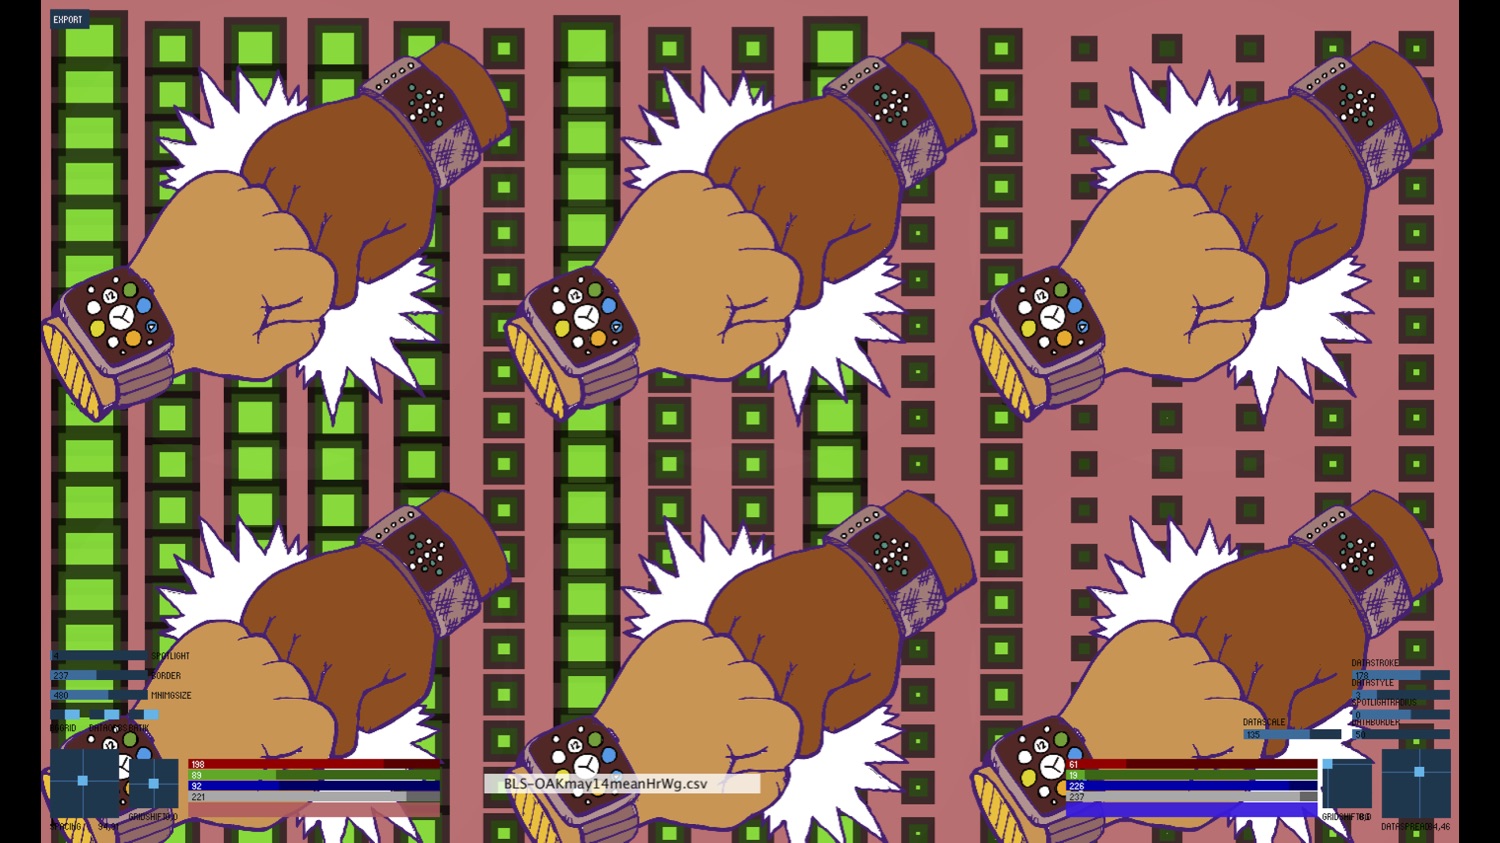
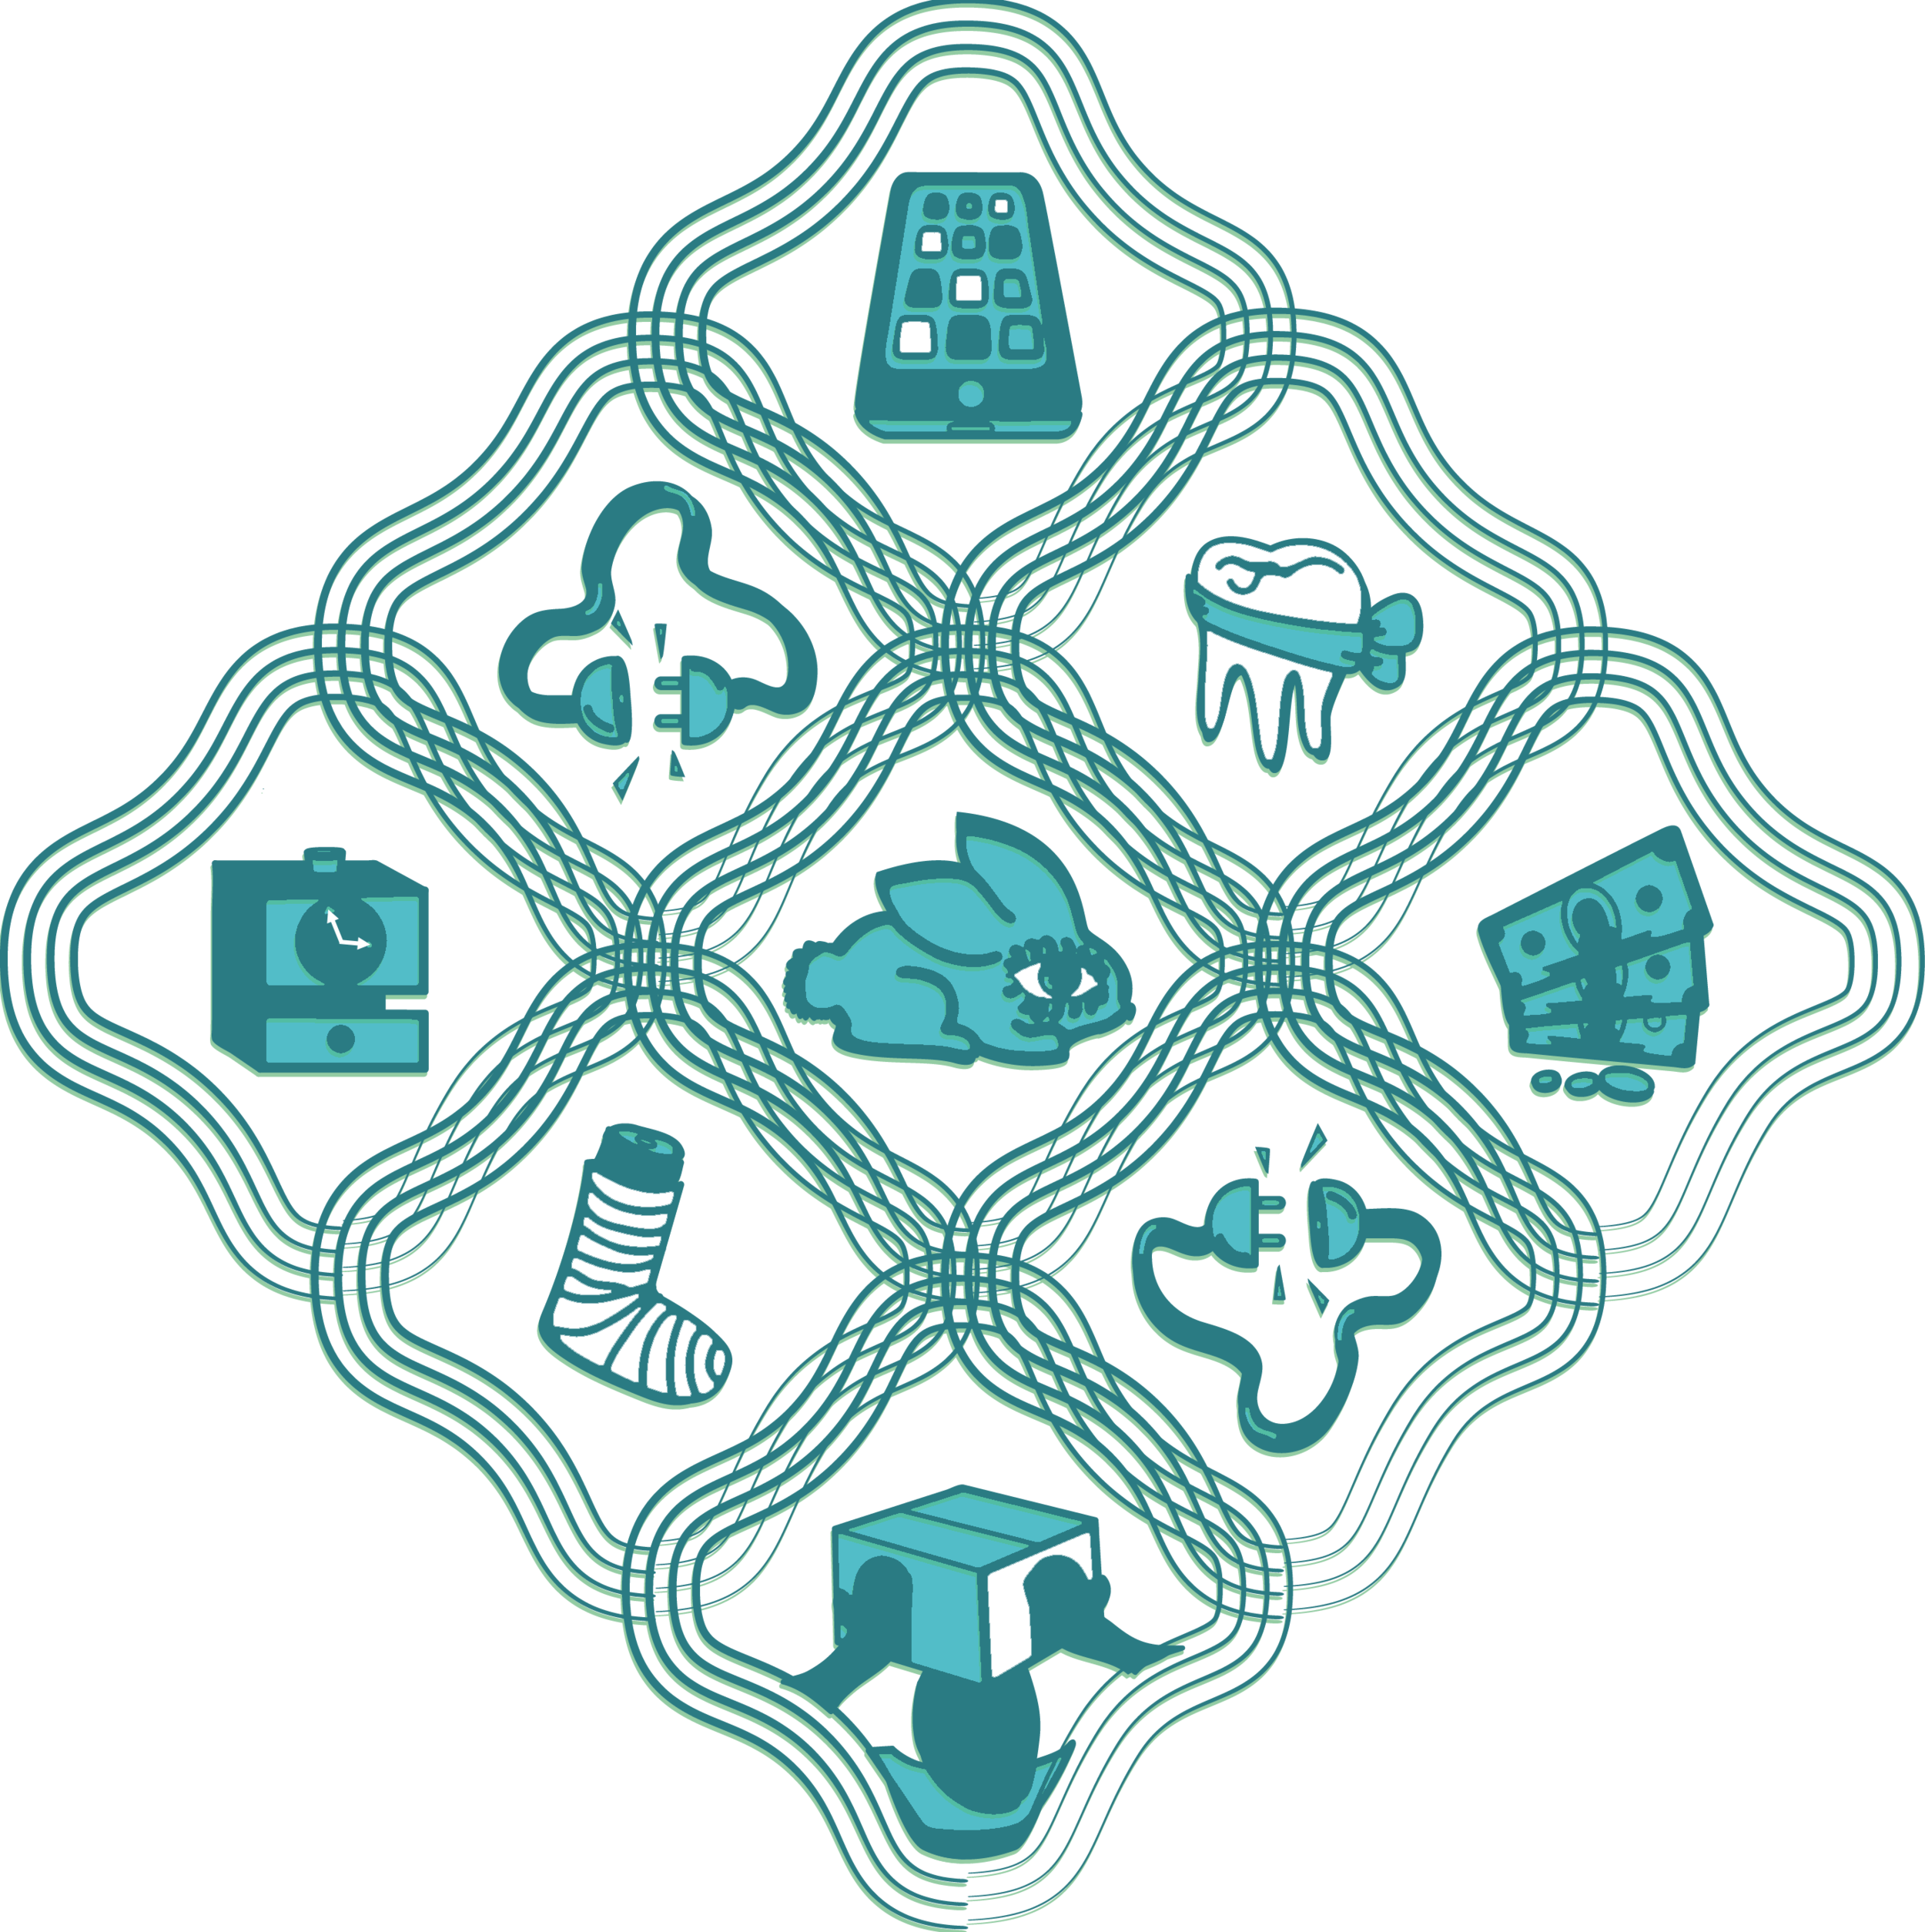
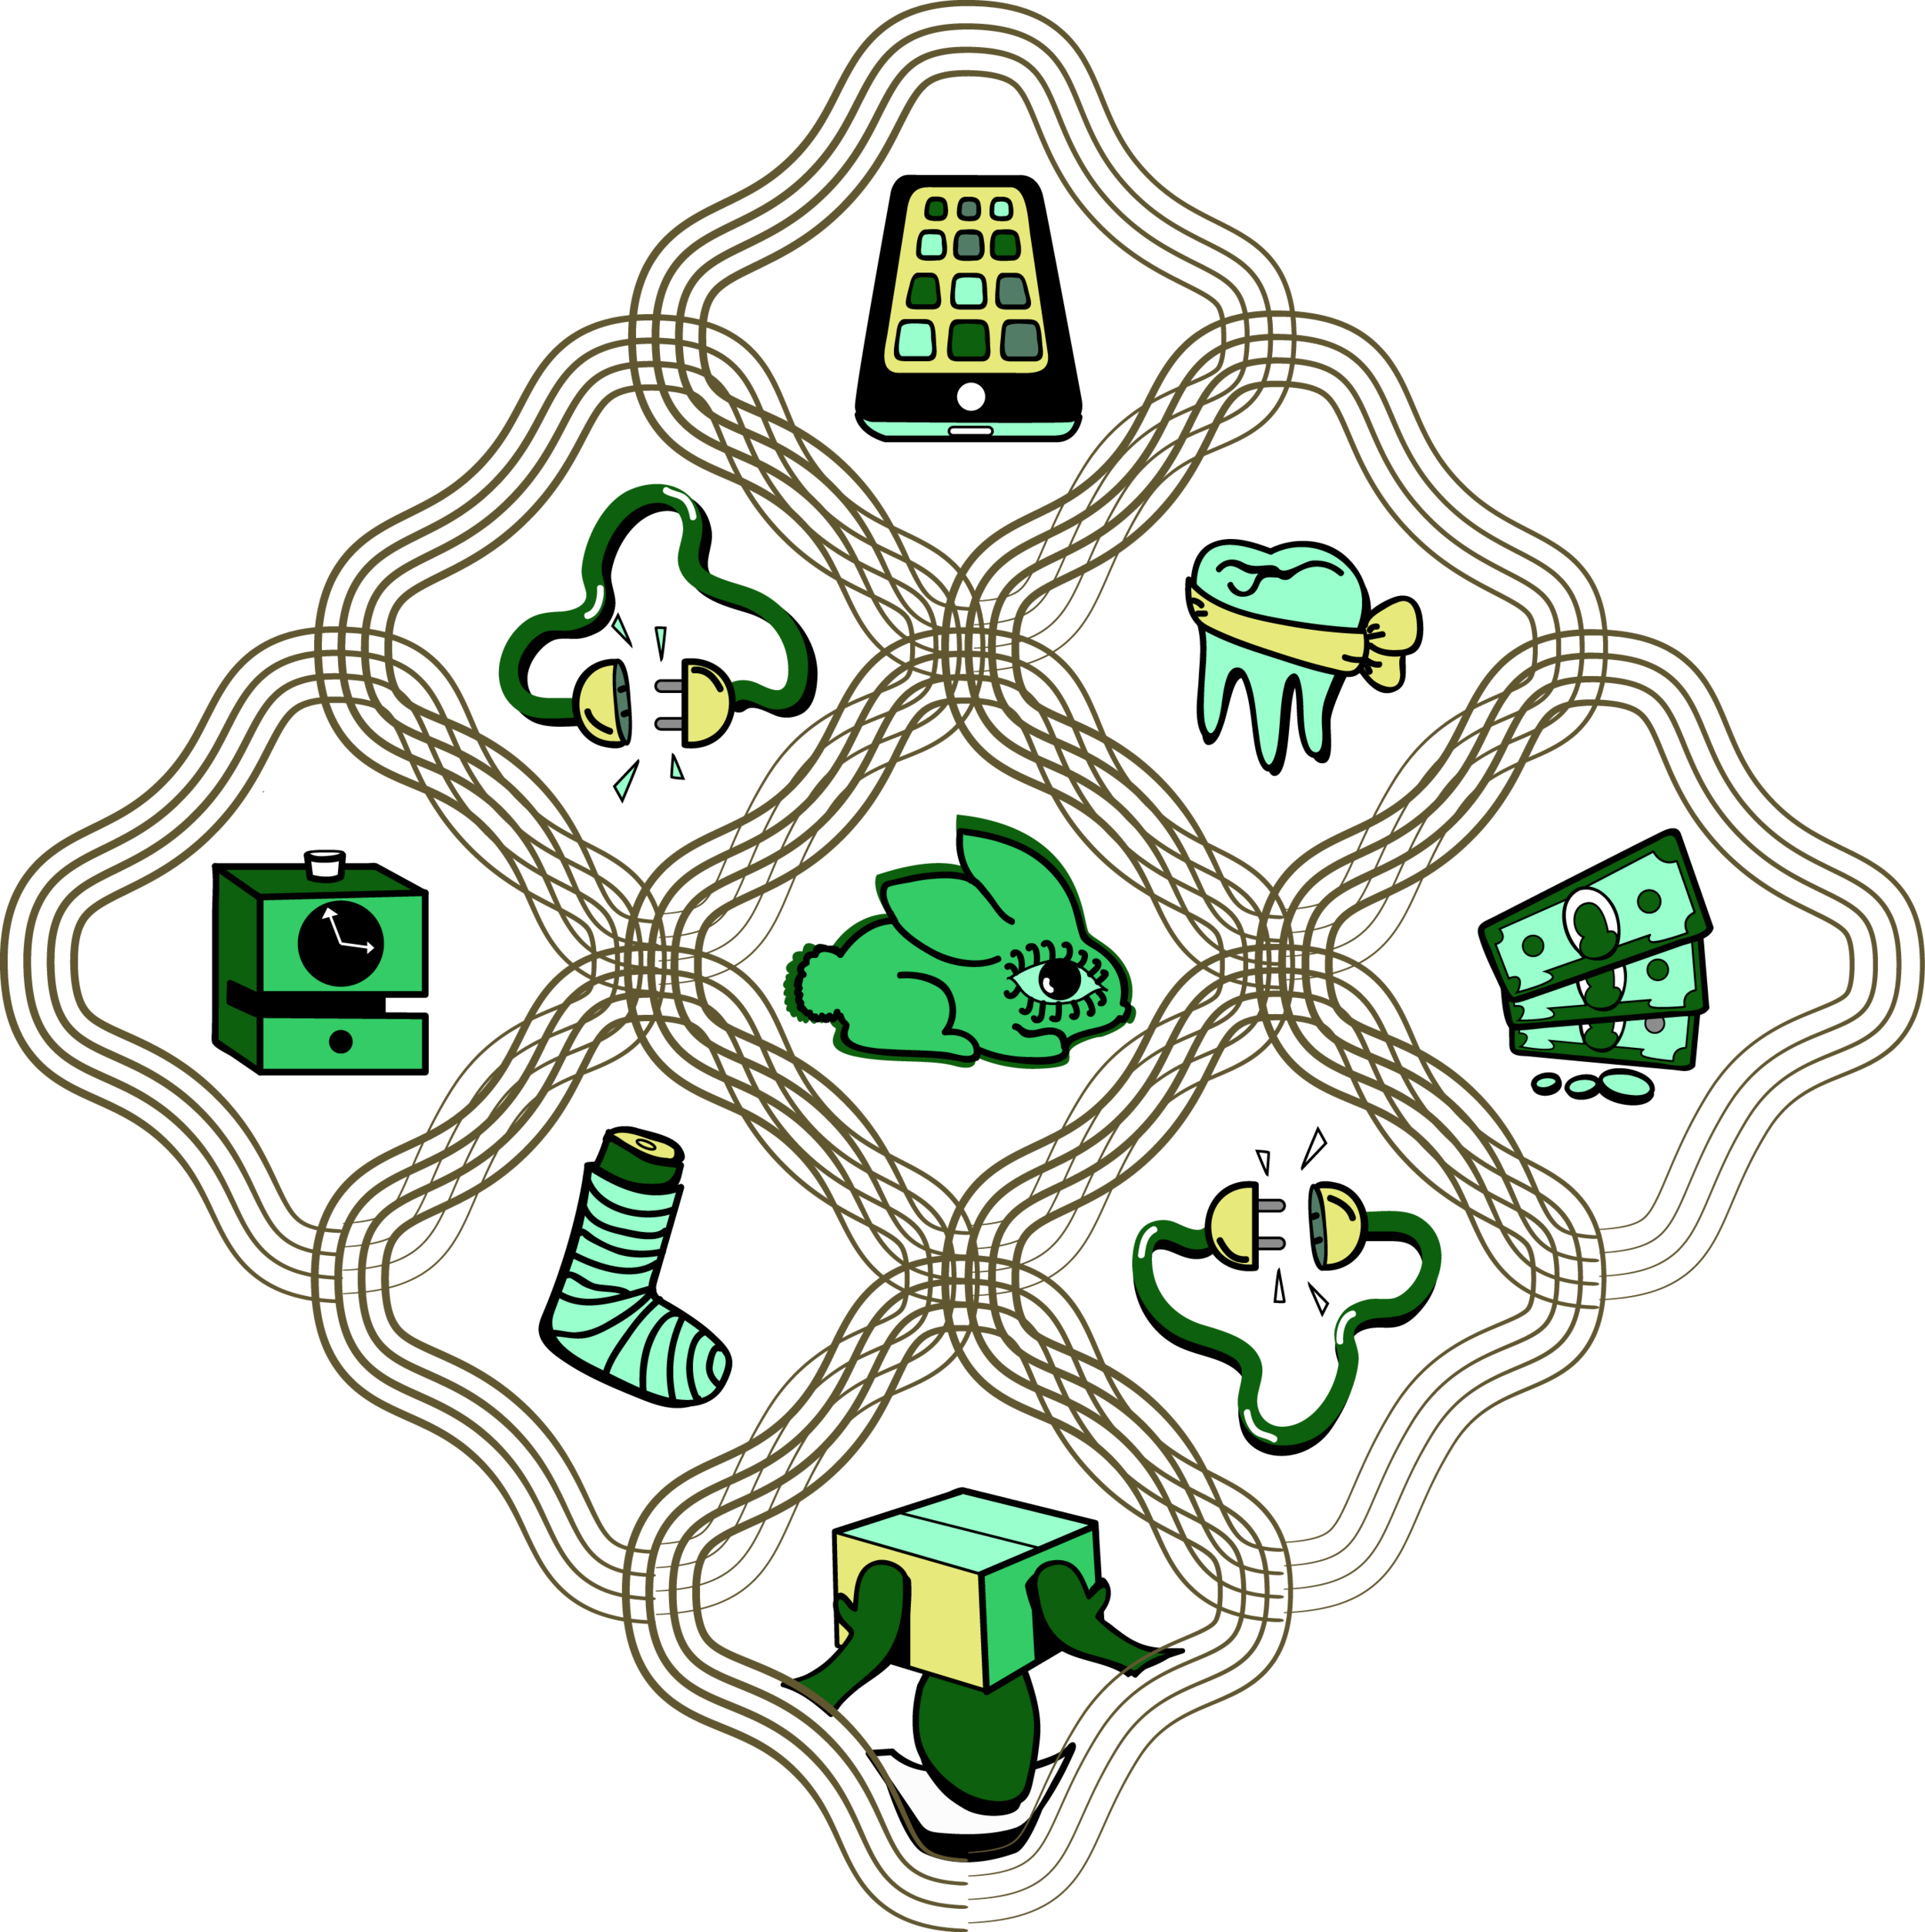
Wearable Tech Fist Bump/Battle >>>>>> Data, represented as hearts from left to right : California quarterly E-waste intake by private companies (in millions of pounds) from 2005 - 2015 >>>>>>  data source

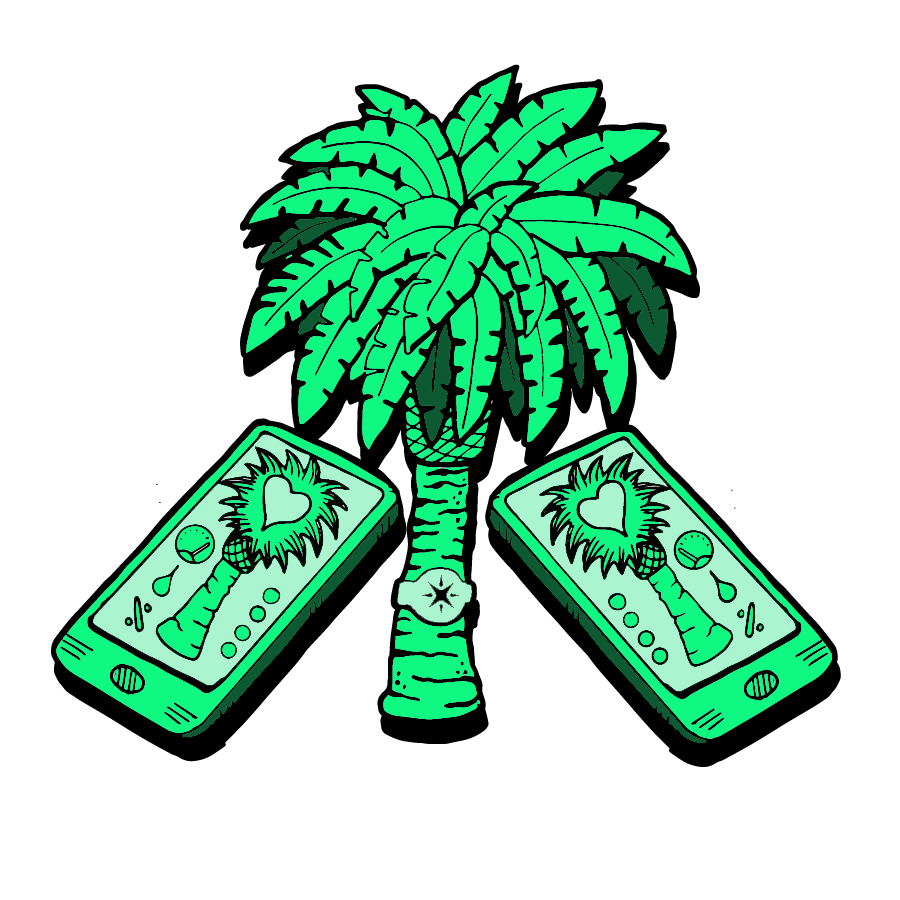
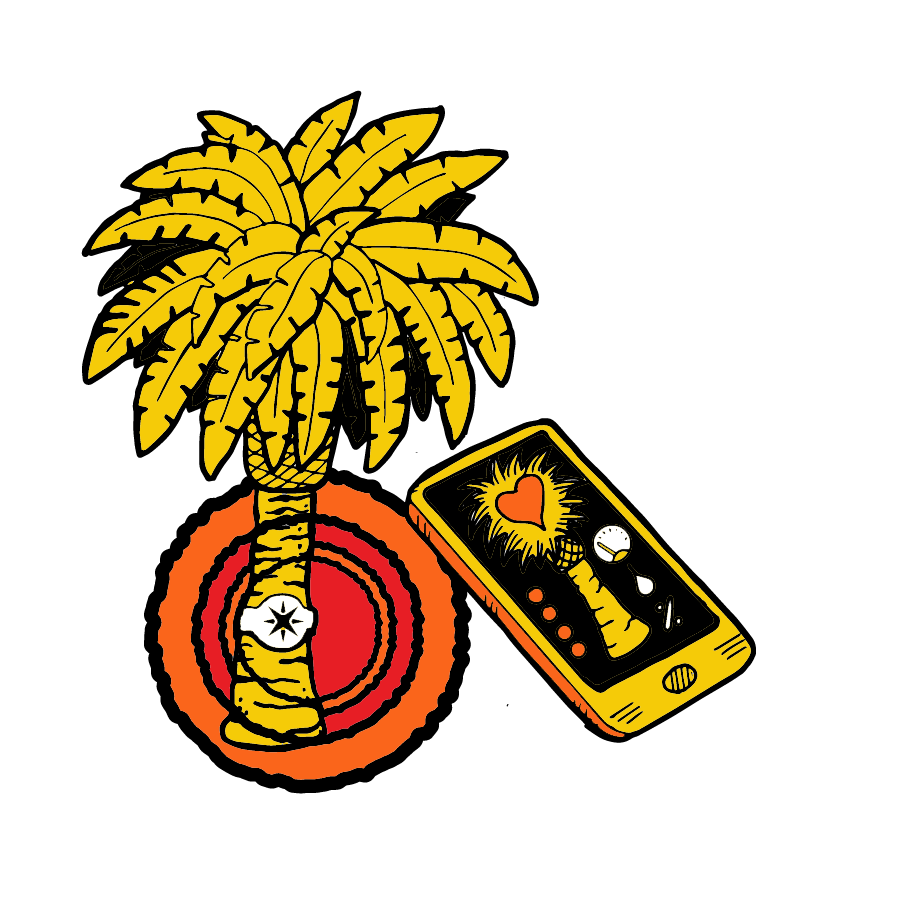
Internet of Things / Environmental Data Monitoring Palms >>>> Data represented as pink circles of lines: Numbers of recorded tree species in San Francisco. data source

I’m ready for the final phase, which is going under the needle to turn these fabrics into wearable items. I’m going to approach this using a few different resources (while still looking for more!). I’m still uncertain of the final display but I’m considering asking a number of people to wear the fabrics and maybe not actually having a designated exhibit location. This is, however, only the latest of a stream of changing ideas.

Creative Code Fellowship Week 6: The Printing has Begun!

After receiving my second set of test prints, I was able to identify some issues with my software and perform some fixes (mainly that I had an almost invisible border - exported around each image - that was showing exactly where the repeat was happening!) I’ve now printed on three different fabric types (Linen-cotton canvas, Organic cotton sateen, and Organic cotton knit), and have determined that the organic cotton sateen, for its color vibrancy and feel, will be the most appropriate fabrics for my first official prints.

Top: $900 wifi tent on linen-cotton canvas. >>>>>Data: San Jose average rent from July 2009 - May 2015
Bottom: Mission Street Condo on cotton sateen >>>>> Data: San Francisco average rent from July 2009 - May 2015

The self-driving car races the California high-speed train.>>>>>Data: Number of people commuting alone in a car to Santa Clara county.

> Progress on tools:


While waiting for the test prints to arrive, I worked out a number of new parametric layout options, this is the latest version of my Processing design tool:

In an attempt to harvest more computing power for increasingly heavy image and data manipulation, I started building a second software tool in openFrameworks. At this point, it's still rudimentary but it has an operational GUI, loads images + data, and exports PDFs.

I’ve expanded my data options as well as my symbology. Some of the newest images (which I may or may not use), include: San Francisco mayor Edward Lee, a Quadcopter, and Internet of Things Palm Tree.

> Finished designs:

Wearable Tech Fist Bump / Battle >>>>>>> Data, represented as hearts from left to right : California quarterly E-waste intake by private companies (in millions of pounds) from 2005 - 2015. data source

Internet of Things / Environmental Data Monitoring Palm >>>>>>>>> Data represented as pink circle of lines: Numbers of recorded tree species in San Francisco. data source

(Design for test print only) Mission Street Condo on cotton sateen >>>>> Data: San Francisco average rent from July 2009 - May 2015

> NOW CONSIDERing:

  1. I want to make the imagery look more “block-print-like.” Only a few of the images have the look I want; I need to keep working the others.
  2. I'm thinking about more varied ways to represent and compare data sets.
  3. I still don’t know what I’m going to do with the fabrics. Here are the top ideas:
  • Work with local tailors to make 2 fairly standard men’s outfits (or at least shirts) and 2 dresses. Then display these items on mannequins or on live people. Potentially against a wallpapered backdrop (I did do a wallpaper test). There might also be a table with a cloth made of yet another design? I love the idea of mixing a variety of crazy clashing designs.
  • Display the fabrics on their own.
  • Work with a CCA fashion grad student  (assuming he still wants to) and see what we come up with together which will inevitably be on the wilder side.

> Just EXPERIMENTing:

Creative Code Fellowship Week 5: New Symbology

This week I focused on expanding the symbology collection available for the fabric designs. I expanded and refined the Mission vending / Web development mash-up series to include: Javascript burrito, D3 flower arrangement, CSS tamale, and HTML ice cream cart.

I expanded the competing transportation series, which now includes: Muni/Vanhool buses, App car service/taxi, and self-driving car / California high-speed rail.

I received my first fabric sample, with which I am happy, the only exception being color vibrancy. I believe this has to do with the porous nature of the organic cotton knit.

I've submitted three more designs which I am printing in larger quantity to see how the designs scale and tile. I am also trying two different fabrics and the lower design as wallpaper.

$900 tent with wifi. Data: San Jose average rents over the last 5 years.

Mission Street condo. Data: San Francisco rents over the last 5 years.

Self-driving car VS. California high speed train (race).  Data: Number of people that commute alone in their car from various Bay Area counties to Santa Clara county. The biggest orange box (which doesn’t even fit the frame) represents inner Santa Clara County commuters. 500,000 people commute alone in their car within that county alone!

Creative Code Fellowship Week 4: More complexity, more data

Most of my progress this week involved adding more complexity to the fabric pattern generation tool. There's still a significant gap between the harsh edges of the vector graphics and the organic look of the actual block print fabrics. I added some background textures, like a generative batik pattern that I think helps bridge this gap. I also added the ability to better visualize the data by printing the first 20 or so data points, as well as the title of the .csv file, at the bottom of the application window. I've added some rental and home value data to the mix.


I've contacted Recology to try to get some data on e-waste collection which I would like to incorporate into my design about wearable technology. This short video from TechCrunch reinforced my worries about the short life these technologies. I'm really looking to incorporate more data sources this coming week. 

I also have some new imagery that attempts to mash up web development logos with Mission vending (burritos, ice cream cart, flowers).

Background data: San Francisco average monthly rents from 2009 - May 2015 (data from RentJungle)

I also added the ability to combine multiple graphics:

Same data encoded in circular pattern.

Same data encoded in circular pattern.

Same data as sine waves.

My first sample fat quarter from Spoonflower comes tomorrow!


Creative Code Fellowship Week 3: meetings, frameworks, and A Fat Quarter

This was an exciting week for the Bay dataFabrics project. I've further focused my concepts and fabric themes. My current summary and public presentation is here. I had a productive meeting with CCA fashion/textiles graduate student Timothy Ho. We discussed a possible collaboration if I can stick to my fabric production timeline. I also had a lovely meeting with Allison Arieff of the amazing organization SPUR. Allison gave me some useful feedback and agreed that housing, transportation and labor are all top socio-political topics to discuss through the dataFabrics. I'm looking over a number of SPUR publications now and will likely ask specific departments for some data sets in a week or so. 

I've sent my first sample design to Spoonflower as a test. I'm getting a fat quarter of organic cotton knit with the clipper card design (below).

The processing framework is coming along and has many new features and as well as an expanded symbology. Notably new: The Fitbit/Apple watch fist bump and the $900 a month AIRBNB tent. Here are a few samples:


Creative Code Fellowship Week 2: Labor

For my first fabric design, I've chosen to build symbology and pull data related to Bay Area labor and income. I've focused my research on what I call "app-labor" but is more often referred to as the gig-economy. This is an economy based around on-demand hourly labor that is accesses through phone, tablet, or web applications. Most of the articles and debate seems to be around "odd-jobs" companies like Taskrabbit / Gigwalk / Zaarly and driving specific services like Uber / Lyft. I've been researching what people find attractive about these business models as well as what makes them the subject of intense debate. 

The idealist view:

“TaskRabbit aims to help people take back their lives, be their own boss, help people out, make some money and just feel good again.” (from Taskrabbit site)

The cynical view:

This "revolutionary" work built out of Silicon Valley convenience is not really about technological innovation – it's just the next step in a decades-old trend of fragmenting jobs, isolating workers and driving down wages. source 

Progress on my SYMBOLOGY:

I'm working on my symbology for this design. I want to create a symbology for both the Taskrabbit "odd-jobs" model as well as on for the Uber driver on demand model. Below: My progress on the former.

Note: The layout was inspired by this design. Thinking about: Connections and Disconnections, time vs. income, benefits (and lack of)

What about the data?

It could be most interesting to find data on some of the things that are "at risk" with this kind of work: Job Security, Benefits, Healthcare, Cost of Living, Labor Unions, hourly wages.
Right now I'm mainly looking at Bureau of Labor Statistics Data: Income, Occupational Data

Quick viz of mean hourly wages for the 22 occupational categories defined by the BLS (May 2014).

Some of my questions:

  • Is there other more explicitly-connected data I could be looking at?
  • I'm having some technical issues connecting with the BLS.gov api. Could use some technical assistance.
  • Is there a way I can use a service like Taskrabbit to collect data? It that too weird?
  • How do these services affect the current part-time migrant labor community?

Image Tiling Framework:

Based on feedback, I spent some time on Friday working on some basic shape and color parametric manipulation tools in Processing. The goal is to be able to iterate quickly and output high-quality PDFs. See it in action here. Output examples below:

Creative Code Fellowship Week 1: Planning!

Yesterday I started the Creative Code Fellowship Program. I can already see what an amazing framework of support Gray Area and Stamen have put together for the fellowship participants. 

What's THE main idea?
Create fabrics, with the look of Dutch Wax Block Prints (popular in West Africa), that use symbology to communicate the prevalence, contrasts, and/or frictions of rapid change as it affects parallel lives in the Bay Area. The background textures of the fabrics will be generativity constructed using data related to the chosen pattern topic.     WORKING TITLE: BAY DATA FABRICS

original proposal and block print examples

more block print examples

The timeline for my project is really short! It's especially short if I want to get fabrics printed and clothing tailored by the August 26th presentation date. I really want use an analog printing process but research is showing that I may have to go with a digital printing process just to stay on schedule.


Here's a rough timeline to start:
 

June 11th - July 16th: 

  • Determine themes
  • Find data 
  • Drawing, Create patterns (4-5) 
  • PAOM and Spoonflower tests
  • Seek tailor

July 16th - July 30th: 

  • Fabric printing
  • Start QR/Web element

July 31st - August 20th: 

  • Clothing tailored
  • QR/Web element

I've already considered and researched some printing options:

Printing lead times:

  • Spoonflower: 7-9 days + shipping (leaning to using this service)
  • PAOM: 2-4 weeks for production.
  • Zoo Ink (screenprint): up to 4 weeks, already taking orders for July
  • Print myself….? CNC Wood Blocks.

What are my data fabric themes? I hope to choose 4 to 5


What kinds of background patterns will I use to encode the data? See the sketchbook

Questions

  • Should I print the fabric by analog process or digital? (Leaning digital due to time constraints) Production ideas?
  • Should I have the clothing custom tailored?  Where?
    (Leaning to yes. Still need to decide on patterns and tailor)
  • How many different patterns and topics should I pursue? 
        (leaning to 4, maybe 5)
  • Data sources?
  • Which themes are the strongest? which should I start with? (leaning to yes)
  • What does the fabric identification system look like?  http://www.qr-code-generator.com/ 
  • Should some designs could be completely abstract (but still based on data)?
  • Should patterns be parametric with many variations?
  • How can I bring something new to the “changes in San Francisco” dialogue?
  • Long term: What happens with the fabric and/or clothing? Sale to benefit local organization?

Other Thoughts:

  • Work fabrics and data like paintings and drawing. Layering, depth of color and texture.
  • How to make the images look like they were block printed?
  • Limited palette


Drawing Machines at LWHS

Just completed a round of drawing machines with my LWHS Device Invention class.  In only 6 short classes students build 8 unique mark-making machines.  A few are below.  See more here.


Brooke and Arjun

Brooke and Arjun

Iyana and Jarad

Iyana and Jarad

Zoe and Warren

Zoe and Warren

School for Poetic Computation Final Reflection : Fall Session 2014

What are some things you created during the fall session? Please provide a brief description and a link.

Adaptive/Assistive Tech (Semester Theme):

New Audiences (Semester Theme):

Wireless Standalone Devices:

Ideas conceived at SFPC and likely to pursue soon:

Generative Work/Digital Drawing:

C O U R S E   S P E C I F I C:

Critical Theory (with Allison Burtch):

  • Single-frame comics based on weekly topics

  • Blog posts

Radical Computer Science (with Ramsey Nasser):

  • Puzzlescript Game

  • PG Version of Puzzlescript Game

  • GPU Programming Sketch (Openframeworks): Abstract

  • GPU Programming Sketch (Openframeworks): Hairy Squirrel

  • GPU Programming Sketch (Openframeworks): Friendly Moiré

openFrameworks Animation (with Zach Liberman):

  • John Whitney Inspired Animation

  • Particle Systems

Hardware (with Taeyoon Choi):

  • What’s inside my computer? (drawings)

  • Cardboard 7-Segment Display (in collaboration with Zach Dunham)

Teaching and Learning Tools:

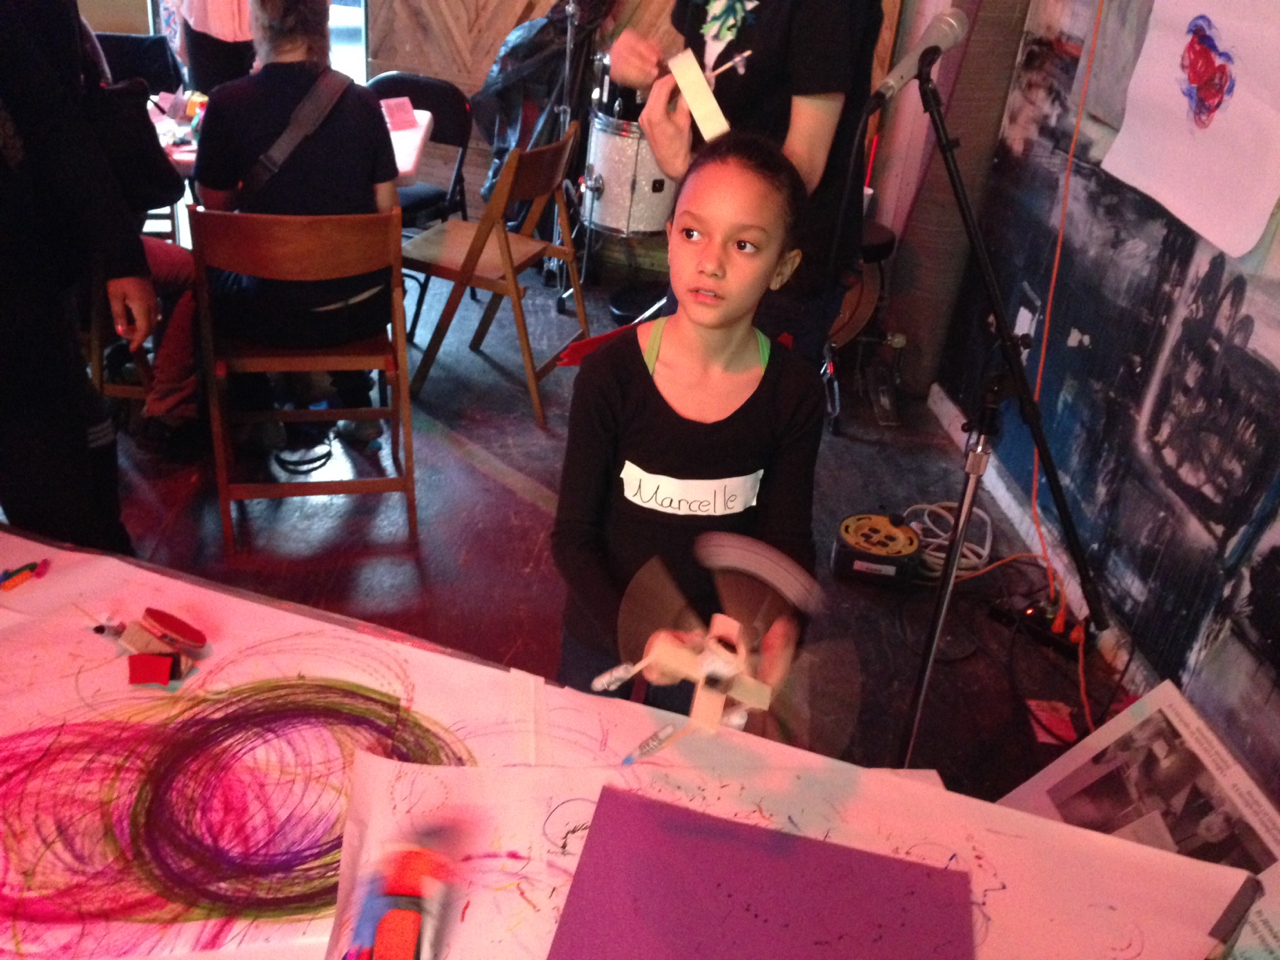
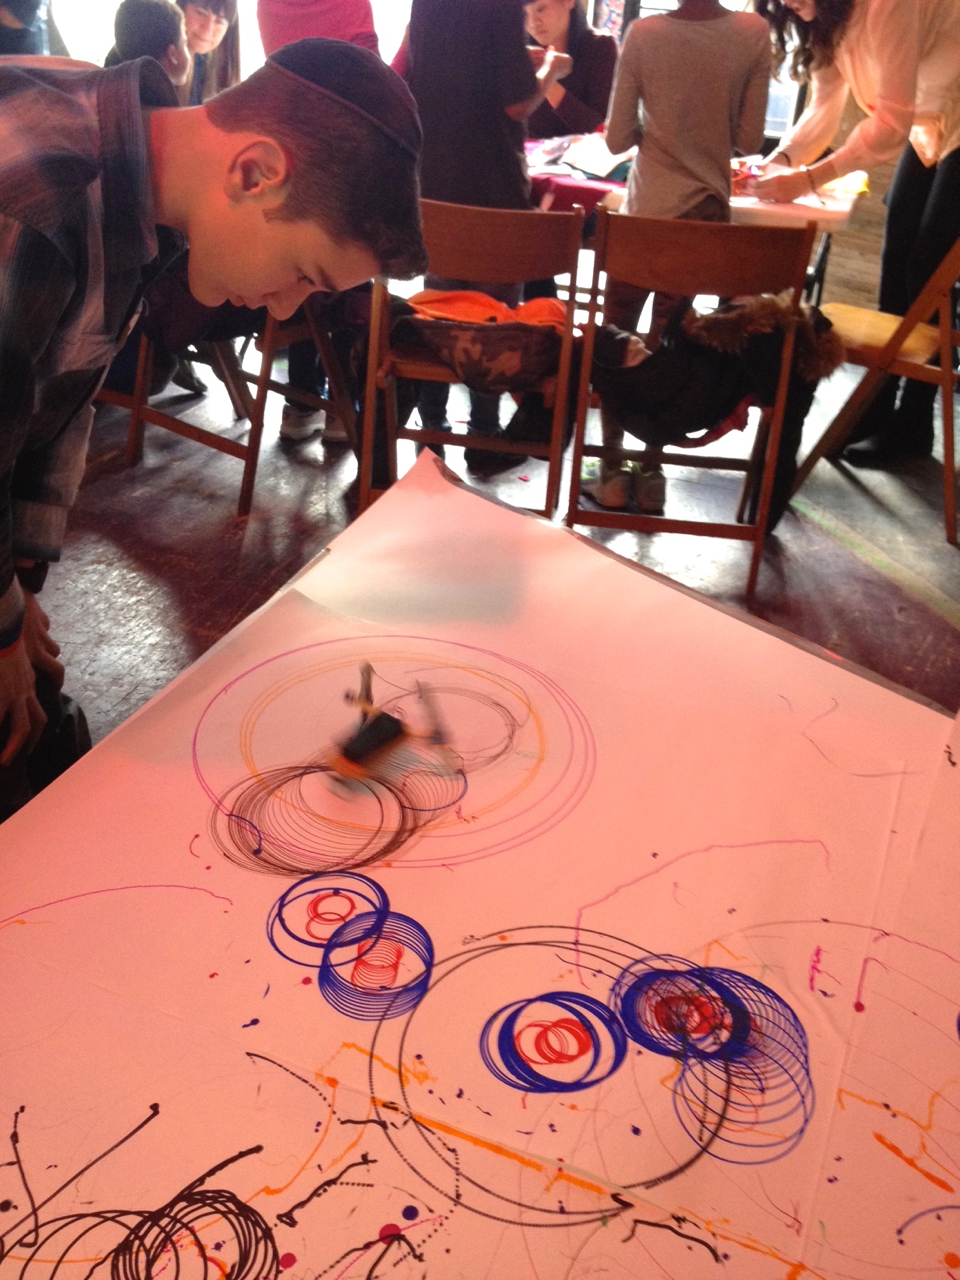
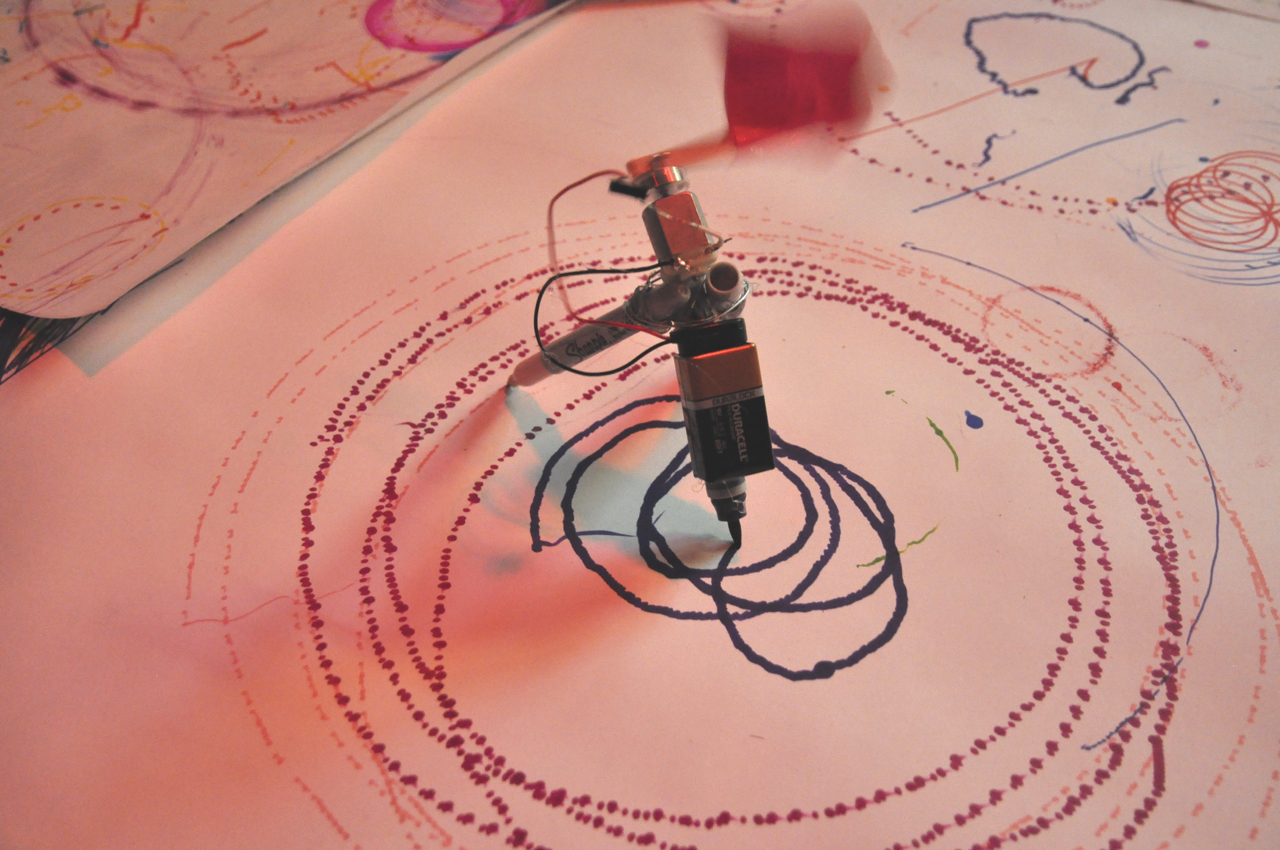
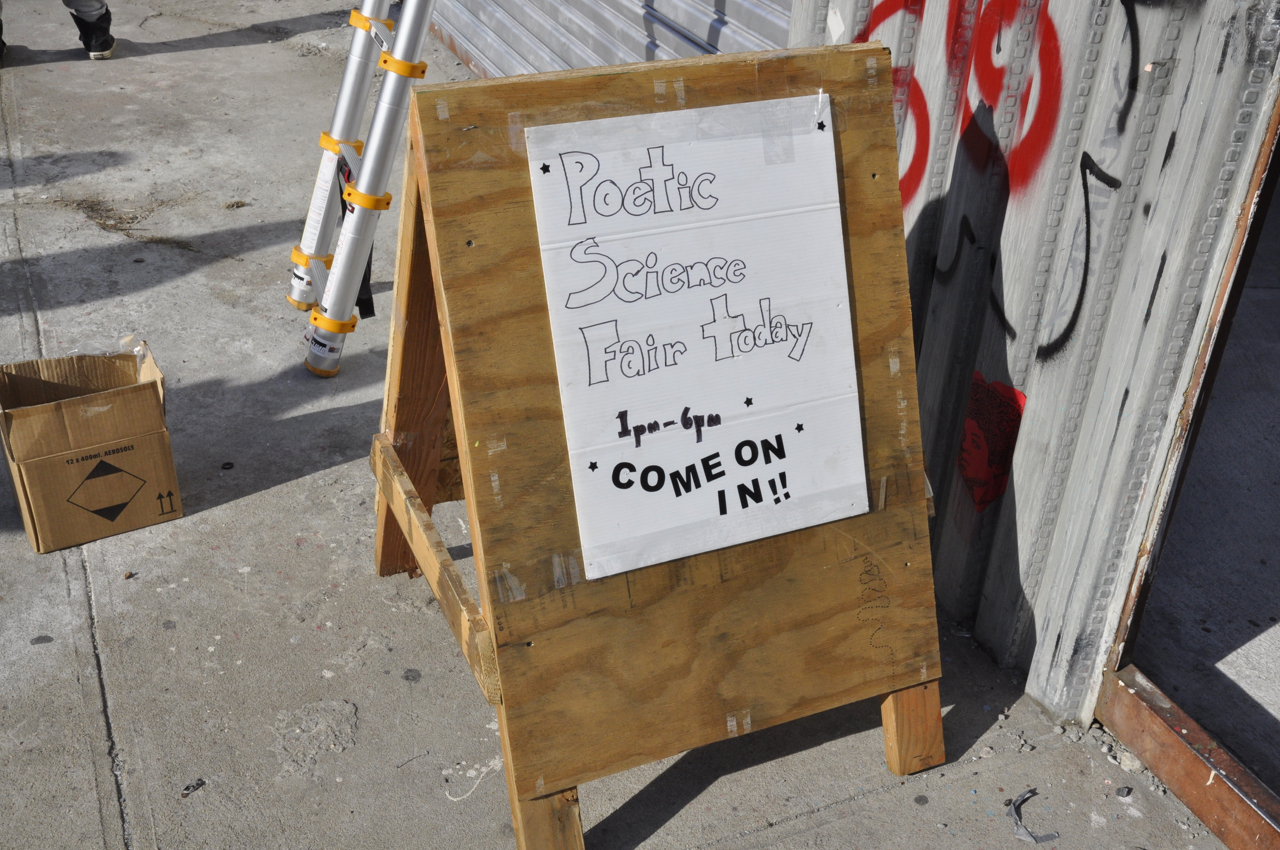
  • Silent Barn “Poetic Science Fair” (also listed above)

  • Arduino Workshops with Zach Dunham for SFPC Students: Newbie Class, Beyond Newbie Class

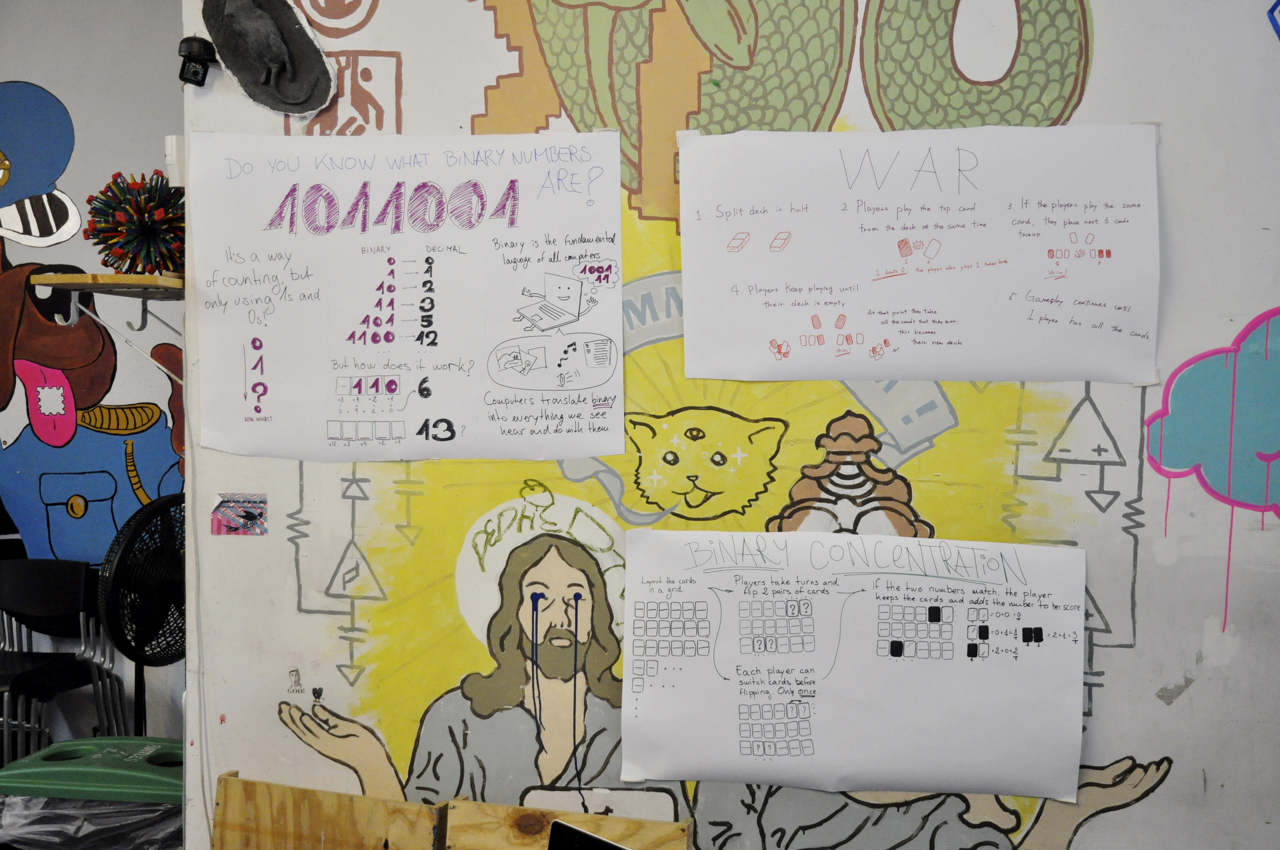
  • Binary Game

What questions are you leaving the school with?  What questions did you come in with?

Questions on Arrival:

  • What are some of the developments in Digital and Electronics Arts in the last 5 years?
     

  • How are artists learning and teaching programming / math / algorithms /experimental computation?
     

  • Can art with computers and electronics be beautiful and/or less time-specific?
     

  • What role does craft and craftsmanship play in digital and electronic art?
     

  • How accessible/open is the media arts world? How can this type of work become accessible to wider audiences?

Leaving With:

  • What’s the “correct” balance between learning and making?
     

  • How will this experience affect my teaching in the short and long term?  What will my high school students / department be game for?
     

  • How can I bring some of the most dynamic elements of SFPC to my own department and teaching practice?
     

  • Can I create an accessible curriculum around the “Internet of Things” for my high school class.
     

  • What are the best and/or most accessible tools for creating stand alone internet connected projects?  What are some of the most compelling projects being made in the is genre?
     

  • When teaching something technical, how much of the process should be guided and how much should be open for exploration?
     

  • Do I actually know enough to be part of the media arts world?  How much does technical skill matter?
     

  • Can digital art transcend the moment?  What are the most effective examples of this?
     

  • How does age affect your status and/or ability as a media artist?
     

  • In what ways is technology-focused creative work the playground of the privileged?
     

  • What topics are most effectively engaged by media arts?
     

  • How can I maintain the level of stimulation and learning that I’ve experienced at SFPC in my life in San Francisco?  What new habits / interactions should I be focusing on?
     

  • Is my work too frenetic? too unfocused? How do I better align my interests/media?  or not?

What are some of your memorable learning experiences at the school?

unBlack-Boxing of Programming, Computers and Electronics:

The school has done an excellent job of deconstructing the often cryptic inner workings of computation.  Opening with an exploration of binary, as well as an activity in which participants devised methods to communicate a simple message without speaking, provided simple yet effective methods to start us thinking about the rigidly literal ways computers interpret input. An early emphasis on the CODE book was also a great backdrop for the program.  Many of the courses continued this theme:

  • Ramsey Nasser’s opening/continuing statements about the constraining legacy of programming languages and computational technologies in general has me thinking about language design and syntax through a new lens. The in-depth exploration of grammars and parsers demistified a number of big-picture programming concepts. I caught myself contemplating a semi-colon the other day. I was thinking: I understand your purpose so much better now semi-colon!
     

  • Taeyoon Choi's presentation of his own work, which is intent on exposing the inner workings of digital logic circuits, twisted my brain severely.  His exercises helped me rethink some of the assumptions i’ve made about what is actually important to understand in electronics. I had been so focused on higher level projects that I hadn’t taken the time to think about the beauty of how each component functioned.  It was also amazing to see the exploration of low level electronics as a topic for artmaking.  It makes total sense; I just wasn’t thinking about it.
     

  • Zach Liberman’s exercises intended to unbox computer vision were also insightful in understanding the algorithms behind identifying basic shapes in an image. Zach’s Early Animation Lectures had a similar power: Power of numbers -1 through 1, Cos/Sin/Atan, Using time in animation.
     

  • Being exposed to the concept and power of GPU programming (Ramsey,Zach L. and Jason Levine).

Other Memorable:

  • Watching the teaching styles of the different teachers at the school.
     

  • Observing the school as a non-traditional pedagogical model/experience.
     

  • Observing the working, teaching and learning styles of my colleagues.
     

  • Aram Barthol Presentation and follow up discussion about his work.  Including the debate on the “artist’s” intentions. “Deep”/”Shallow” work, The role of unsuspecting viewers, Implications of making art that references memes or very time-specific technologies.
     

  • Discussion with Sarah Hendren. Talking about the genre of “Design Fiction.”  Discussing work that has no specific home (i.e. gallery, design world, publication, etc) and cannot be easily categorized. General discussion on Adaptive/Assistive Technology.
     

  • Talks by Ida Benedetto and David Horovitz: Thinking about working between disciplines (design, art, bookmaking, history, time-specific) and creating an experience as the work.  “What’s the gift?” - Ida
     

  • Christine Sun Kim visit: Thinking about adaptive tech + Working with sound as a tactile medium.
     

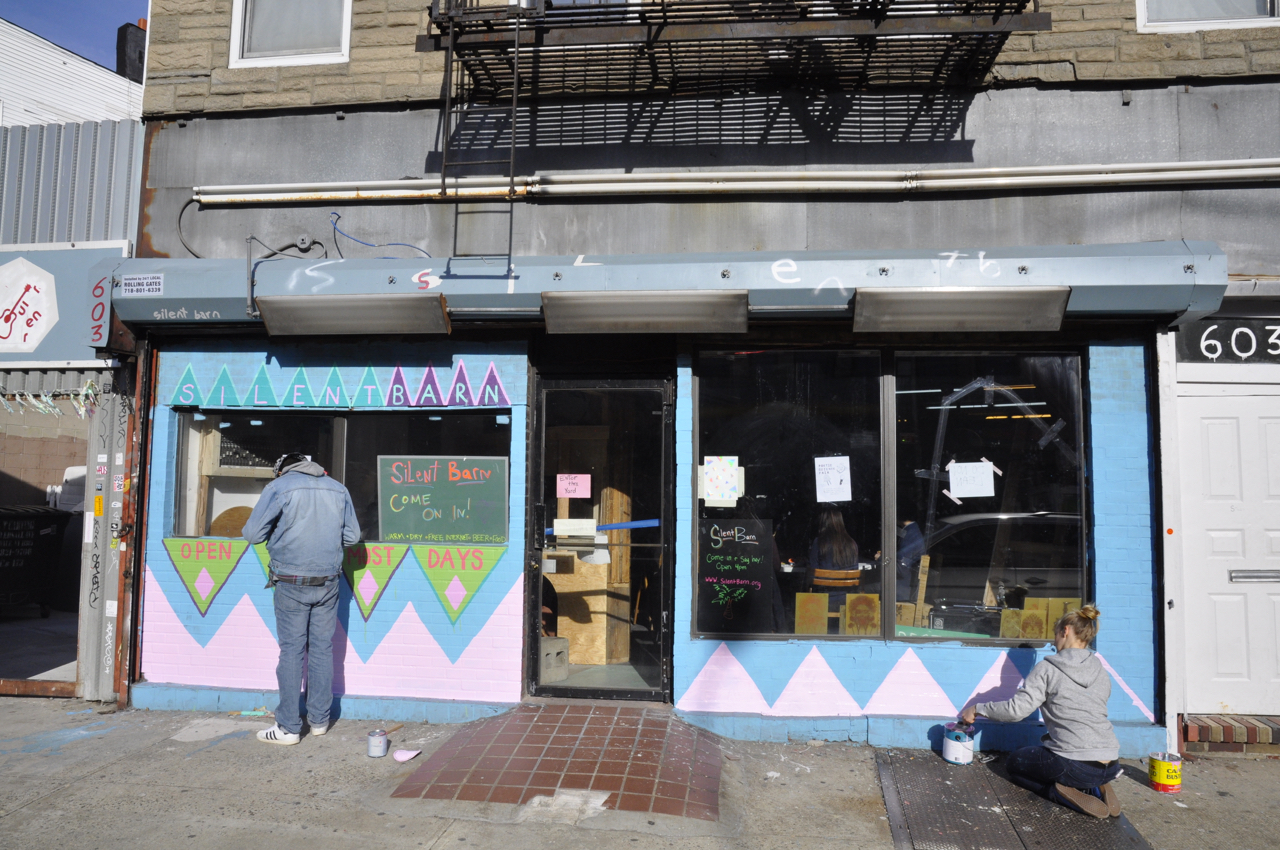
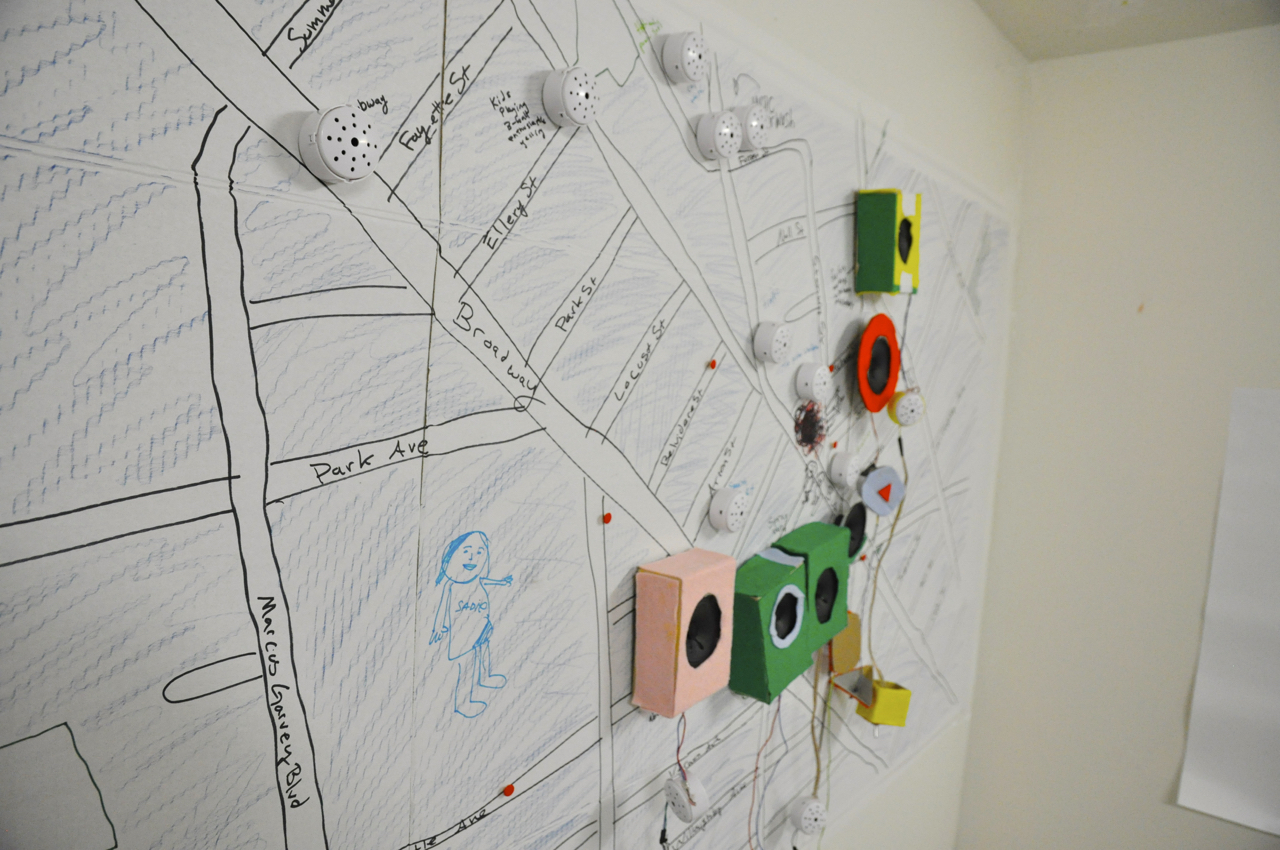
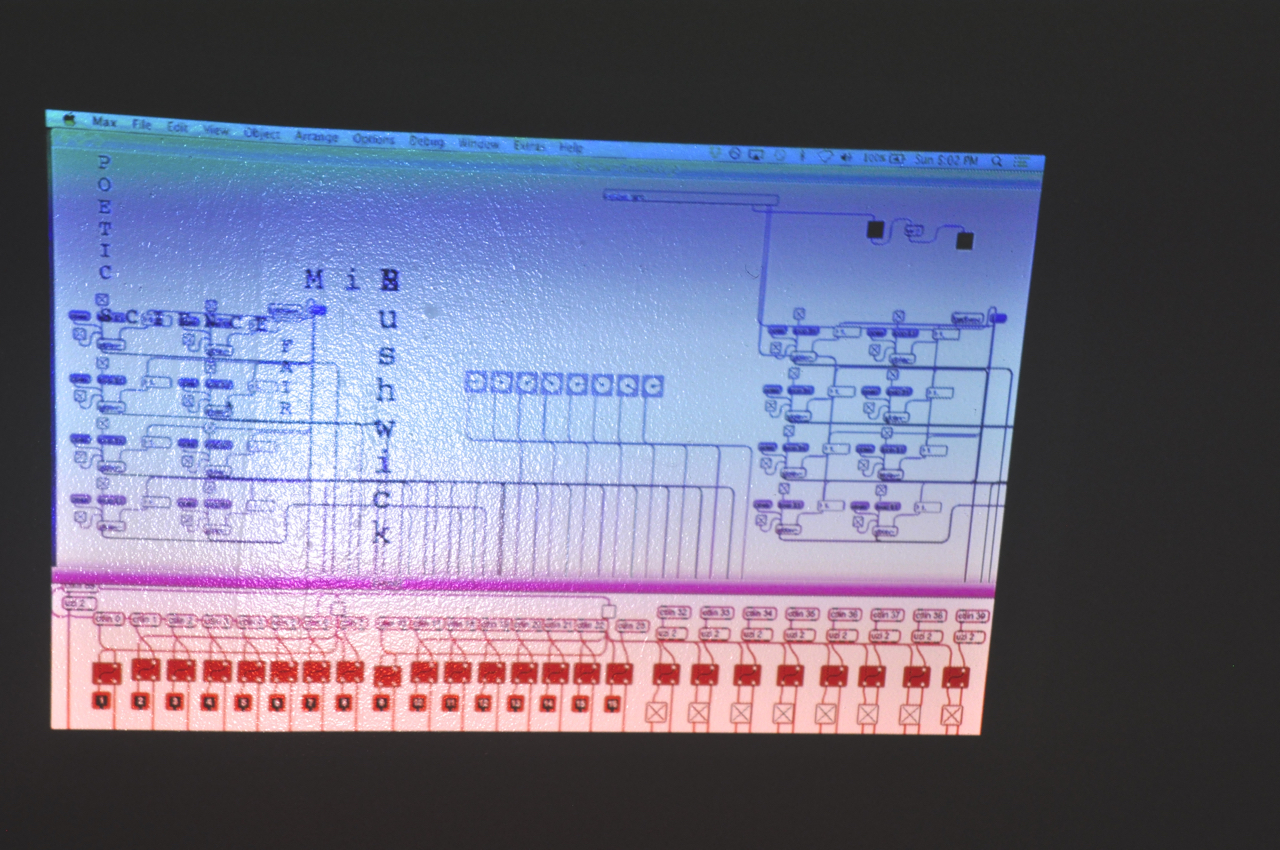
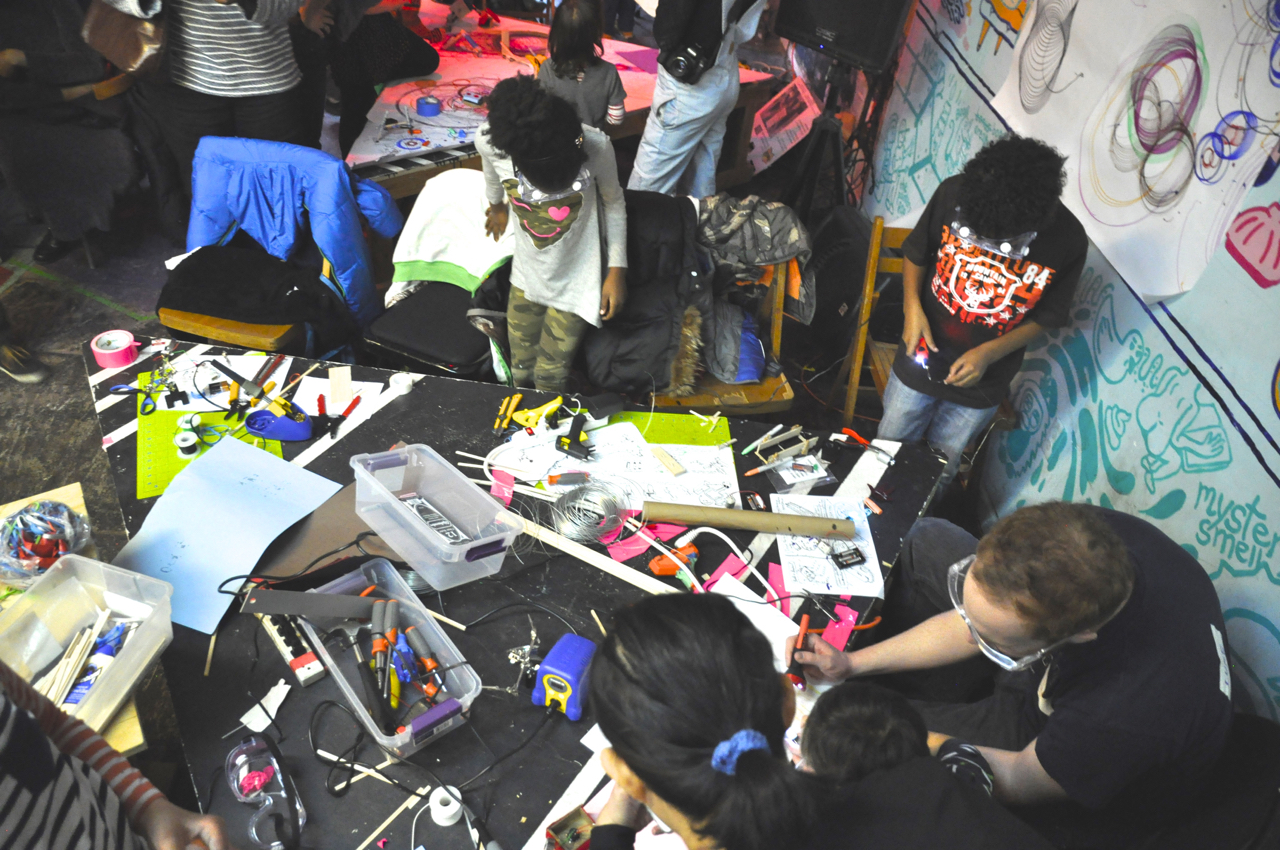
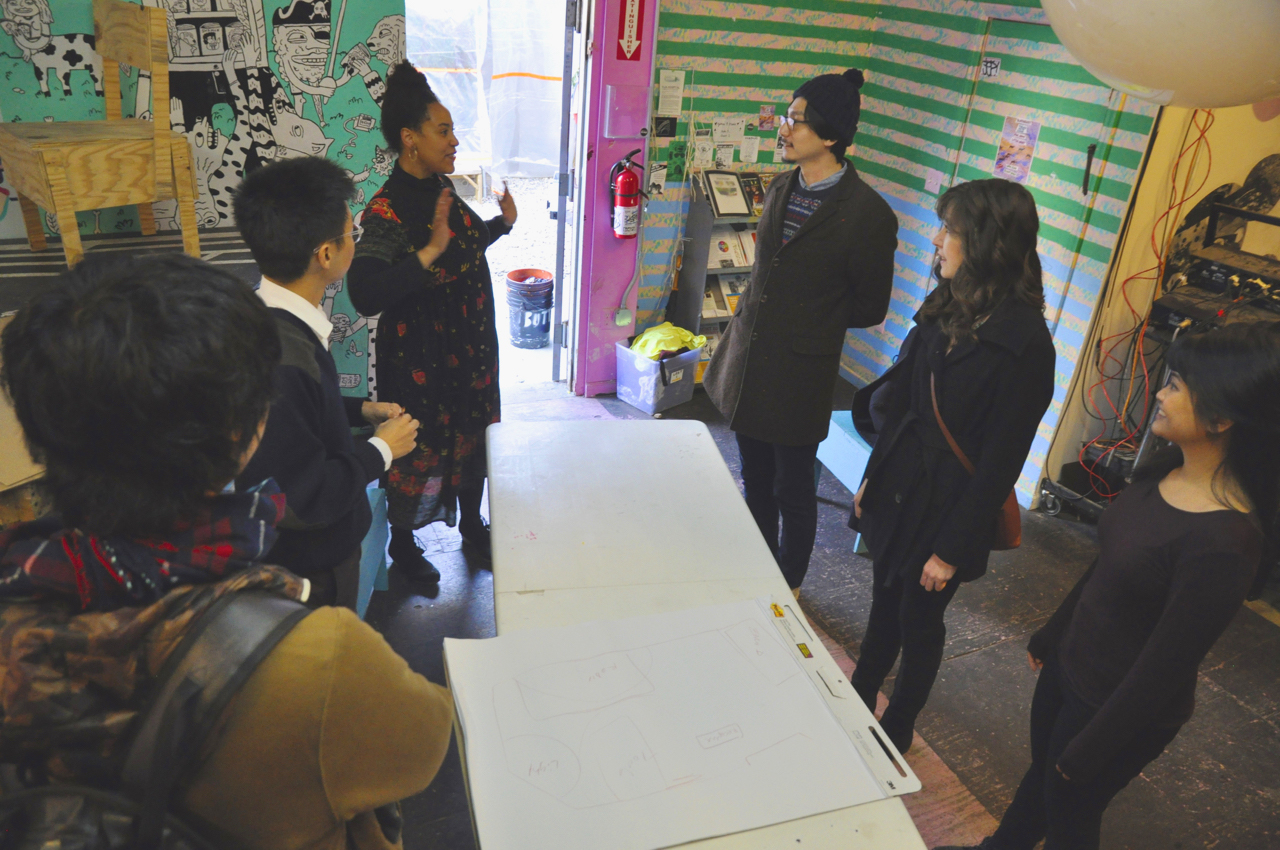
  • Helping to organize and lead workshop at the Silent Barn community event.
     

  • Mushon Presentation : What are the algorithmic prejudices built into the data.  How do we identify them?
     

  • Critical Theory Topics (Allison Burtch Class):

    • What was the vision?: Thinking about the promise VS. actual impact of technology on education),

    • Decentralization: do technologies distribute power or concentrate it?

    • Internet of Things : in what ways is the internet of things an opportunity for more detailed data collection?
       

  • Being ok to present projects in progress and ideas in their early stages (SFPC/New Inc mixer + SFPC/ITP mixer).
     

  • Thinking about creative ways to see text as a creative visual tool (beyond design and writing). Inspired by Zach L. and Todd Anderson.
     

  • Sha Hwang lecture: Jewelry as vehicle for storytelling. Experince at Healthcare.gov. + implications of choosing that opportunity.

What would you'd like to teach and share after the school? and how would you like to teach?

I'm fortunate that I have a teaching job that I’m headed back to with a built in enthusiastic audience and a high level of autonomy toward experimenting with new technologies.  Some of the ways I anticipate my experience at SFPC will influence my teaching:

  • My classes have been very focused on hardware.  I will likely be adding more software tutorials (mostly using processing as that’s what’s already taught in my school, but possibly some openFrameworks as well) to allow students to more seamlessly bridge these worlds.
     

  • I have a new appreciation for the initiatives at my school around curricular/programmatic alignment.  SFPC has been AMAZING but at times it felt frenetic.  While that has facilitated a wide range of experiences, it has also allowed for some of the stated semester themes-New Audiences and Adaptive Technology-to feel peripheral in some of the classes. Creating alignment between teachers and classes around themes and expectations is forefront in my mind.
     

  • I really appreciate a classroom with a mix of demo and hands-on. I’ve found that I gain a deeper understanding of a topic or process when I have time to try it, and take ownership, before moving to another process. I know this can be hard to coordinate in a classroom of varied skill levels, but I am going to be looking for better ways to mix demo and hands-on activities.  I've tried a number of information delivery techniques in the past but I am now more likely to spend time working students through a series of short exercises as opposed to lengthy lectures/demos with large amounts of information.
     

  • I want to continue to look for as many tools as possible to explain some of the more difficult concepts in computation, programming and electronics.
     

  • It has become more important for me to emphasize the “Why”, the “for whom” as well as add a critical context to every teaching project addressing technology.
Comics Critiquing Technology

These single-frame comics summarize my thoughts on the 7 weekly themes from Allison Burtch's Critical Theory class at The School For Poetic Computation. The drawings were created on paper and scanned.  The backgrounds were generatively produced using Processing.

Topic: Decentralization and its Discontents

Topic: Decentralization and its Discontents

Topic: Internet of Things

Topic: Internet of Things

Topic: What was the vision? (computers and education)

Topic: What was the vision? (computers and education)

Topic: Political Change and Riots

Topic: Political Change and Riots

Topic: Messaging and Language

Topic: Messaging and Language

Topic: Utopias and Sci Fi

Topic: Utopias and Sci Fi

Topic: Privacy and Surveillance

Topic: Privacy and Surveillance

Work in Progress: Orientation Triggered Audio Object

I'm working on a set of objects that can trigger various samples based on orientation.  I plan on making three+ of the these objects that tether wirelessly to a single amplifier and audio source. I'm not sure what the final enclosure of the devices will be but I have considered the "Junk Orchestra" idea (image below). The choice of samples/audio is also under careful consideration.

Technical: This project uses a Teensy controller and audio adaptor board.  Orientation is measured with Adafruit's 3-axis accelerometer.

_DSC0001.JPG

SMS Word Bubble Project

This is a prototype for my first “wearable” project. This word bubble turns SMS messages into very visible accoutrements with the use of a high-contrast OLED character display.  The object may invoke unexpected conversation or simply reveal an often hidden method of daily communication. The device can also act as an adaptive technology that allows for simple nonverbal communication. Alternatively the user can share the messaging number and wear whatever anyone decides to message (be it serious, funny or otherwise).

Technical: SMS Communication is managed by an Arduino, Adafruit's FONA module and a T-mobile SIM card. 3D modeling done with Rhino. Printing done using ShapewaysThe project is still in testing but working well so far!